Created on 07 Mar 2020 ; Modified on 08 Jul 2022 ; Translation: italian
Data updated at 2025-01-08.
For those who have consulted this WEB page before 2022-07-08. Given the persistence of the Covid-19 epidemic, we have decided to aggregate data by week instead of using daily data provided by the Ministry of Health. We have also radically simplified the amount of data observed, limiting ourselves to new cases and deaths.
Here we report the trend over time of the data relating to the COVID-19 epidemic which has hit Italy since February 2020. The source of these data is the Ministry of Health, and the Civil Protection performs their diffusion.
Here we have two sections where we report data:
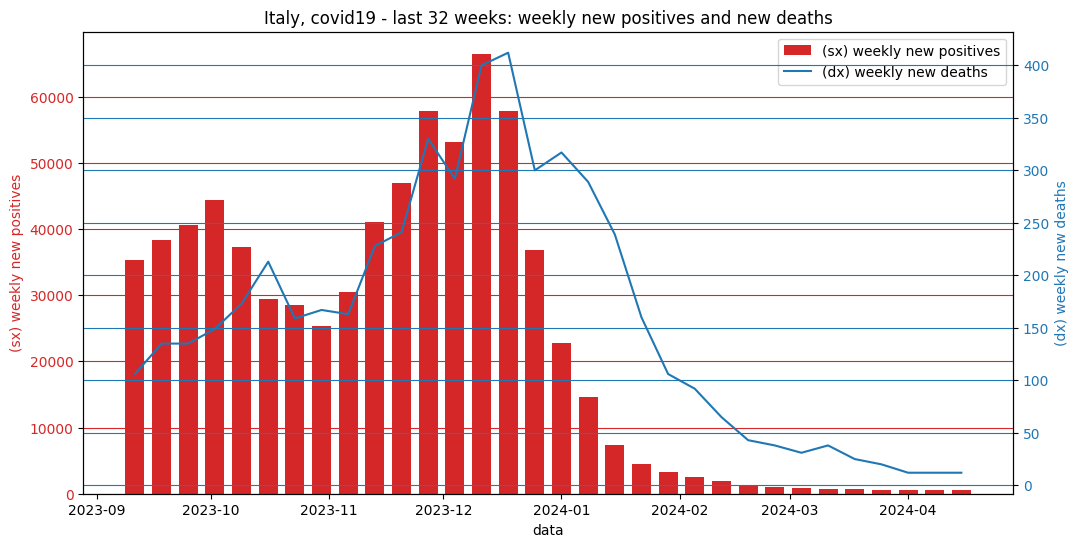
Below we report at January 2025 trend of new covid cases and that of deaths, calculated weekly in the last 32 weeks. In particular:
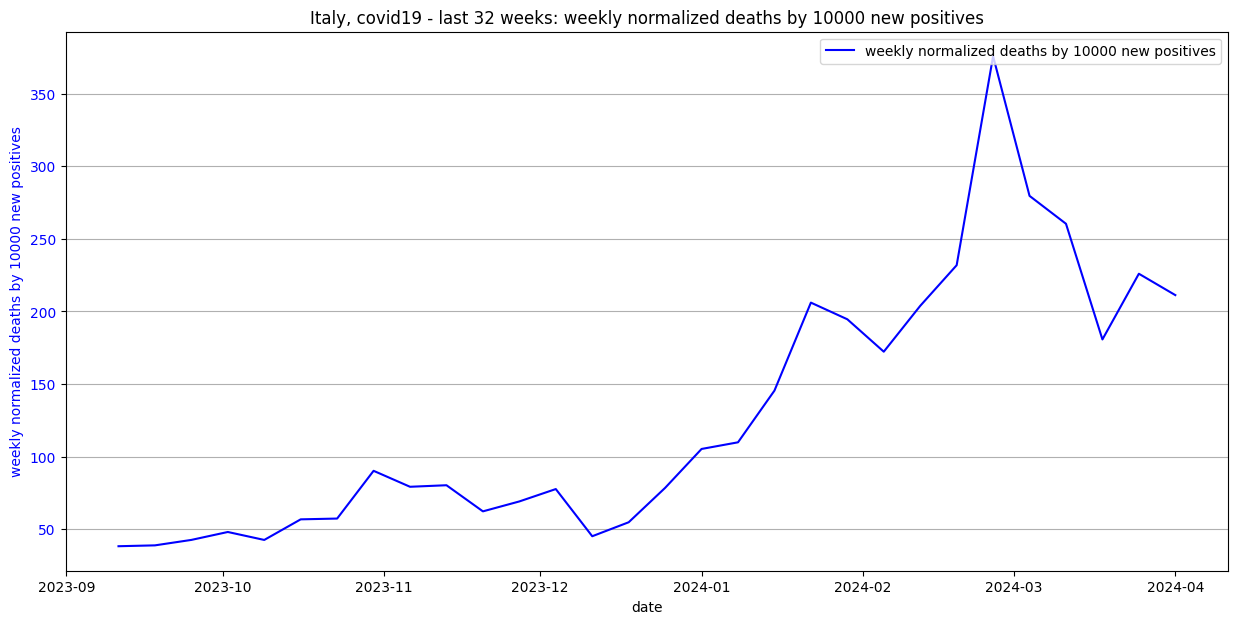
While the following graph displays the normalized ratio of deaths per 10,000 new positives during the past 32 weeks. The detail of how this ratio is calculated is described later in this article.
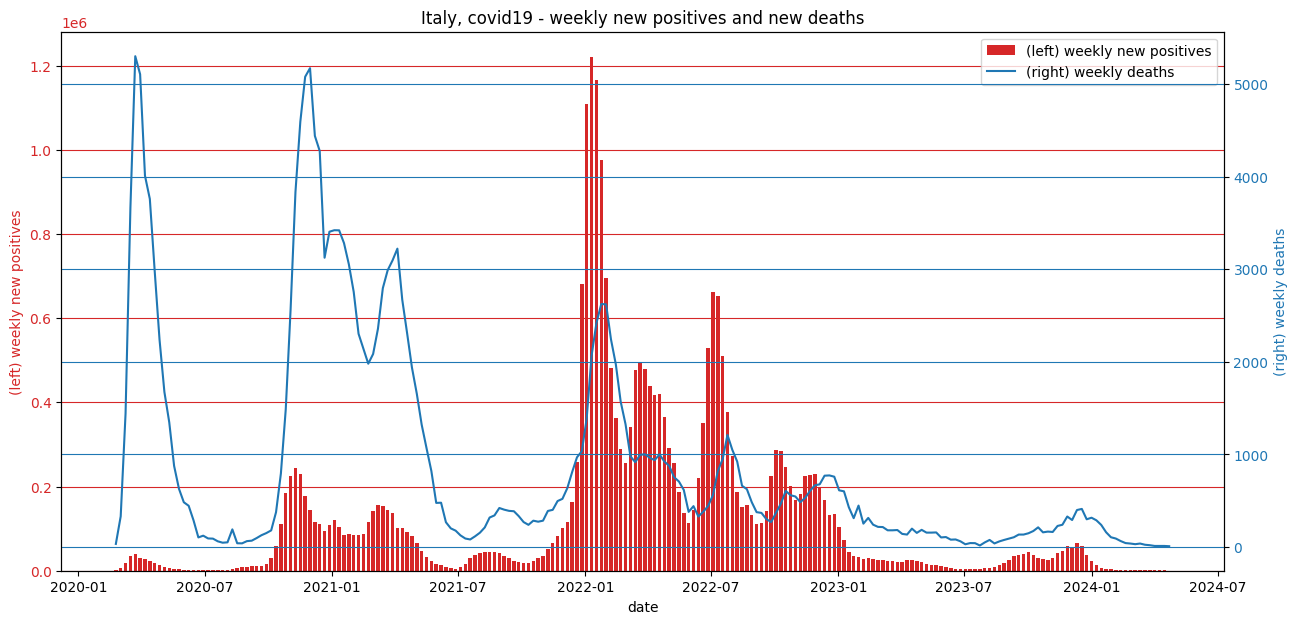
Instead, the following graphs cover the entire period of the epidemic, from February 2020 to today.
Below is the histogram (red vertical bars) of the new cases of covid-19, calculated weekly. On the left there is the scale with the relative values, expressed in millions.
In addition, we also report the number of deaths (blue line), always calculated on a weekly basis. In this case the scale with the values is on the right, and is unitary.
One may wonder what relationship there is between the number of deaths and that of new positives. This analysis requires some precautions:
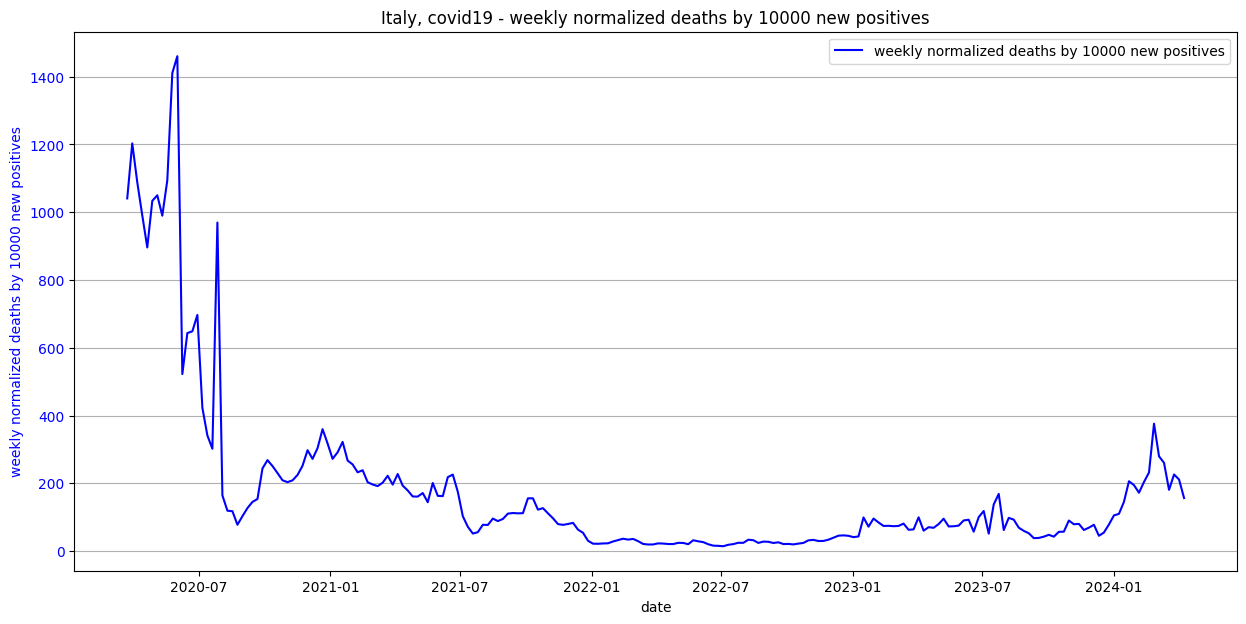
With the aforementioned attentions, we can normalize the number of deaths per 10,000 new positives. Excluding the first four weeks, that have enormous values, after the first month of the epidemic we get lower values.
The following graph shows the trend of the normalized ratio between deaths and per 10,000 new positives. Excluding the first 4 weeks.
Looking at the graph showing the new positives throughout the whole period of the epidemic, the different macroscopic waves are clearly observable. Notice how the first wave, in the spring of 2020, had a number of new positives rather limited (less than 40,000 new positives/week). But mortality was very high, reaching over 5,000 deaths per week.
Next wave, the Delta variant, from winter 2020 to spring 2021, had a number of new cases higher than those of Alfa, reaching over 200,000 cases per week. But the here the mortality, although still high, did not exceed in absolute value the mortality of Alfa.
With the Omicron variant, from winter 2021 to summer 2022, the peak of new cases has soared to over 1 million 200,000 cases in one week. Fortunately, mortality in absolute values is practically halved. At the peak it was around 2600 cases per week.
Thinking about death rates in relation to 10,000 new cases, at the peak of the Alpha variant, we can observe little more than 1400 deaths every 10000 new positives.
While with the Delta variant the the same ratio drops to less than 400 deaths every 10,000 new cases.
As you can guess, with the Omicron variant the relationship under analysis improves, and by a lot. We observe that, at the peak, it dropped below 200 cases for every 10,000 new positives. Arriving in the summer of 2022 at values of the order of a few tens (this aspect can be seen well in the graph for the last 32 weeks). That is to say a mortality (ironic) only 4 or 5 times higher than that of the flu.
Another aspect worthy of consideration is the fact that the temporal diffusion of variants of the virus has gradually increased. The significant incidence of the Alfa variant has declined in a few months: in July 2020 the new related cases were less than 2000 per week, except for a slight recovery in August, probably due to import from the holiday areas and in September, with the reopening of the schools.
But the Delta variant began to dominate in the fall of 2020 to continue to be present until July 2021, when it was replaced by the Omicron. Almost a year of presence.
While Omicron is showing much more resistant, given the values of new cases in both spring and summer 2022. Values, at the summer peak, more than 600,000 cases per week.
What we have observed in relation to the death rate should lead us to think carefully when we listen phrases like: "it is little more than an influence". Even because if the Omicron mutation proved to be much less dangerous than the previous ones, nothing prevents the next variant may be more contagious and more dangerous at the same time. In this respect, the case of the Spanish flu should remind us of something.
Not only. We have seen that summer is no longer a bulwark against the spread of the virus. Probably due to the lifting of restrictions on the use of masks and the lack of compliance by the population with the hygienic and spacing rules.
So we think it is fundamental, even in Omicron times, counteract the mutations of the virus. And to do this we have two weapons:
Below is the detail of the data used to generate the graph, extrapolated from this data source published by the Civil Protection:
| year | week | new_positives | new_deaths | new_swabs | normalized_deaths_by_10000_new_positive_cases | positive_cases_by_100_swabs | date |
| 2020 | 9 | 1686 | 34.0 | 21127.0 | 8558.72 | 7.98 | 2020-02-24 |
| 2020 | 10 | 5681 | 332.0 | 28810.0 | 6454.85 | 19.72 | 2020-03-02 |
| 2020 | 11 | 17372 | 1443.0 | 74962.0 | 3052.61 | 23.17 | 2020-03-09 |
| 2020 | 12 | 34391 | 3667.0 | 133503.0 | 1485.27 | 25.76 | 2020-03-16 |
| 2020 | 13 | 38551 | 5303.0 | 195628.0 | 1040.7 | 19.71 | 2020-03-23 |
| 2020 | 14 | 31259 | 5108.0 | 237431.0 | 1203.17 | 13.17 | 2020-03-30 |
| 2020 | 15 | 27415 | 4012.0 | 318732.0 | 1088.46 | 8.6 | 2020-04-06 |
| 2020 | 16 | 22609 | 3761.0 | 346348.0 | 990.76 | 6.53 | 2020-04-13 |
| 2020 | 17 | 18703 | 2984.0 | 401118.0 | 896.11 | 4.66 | 2020-04-20 |
| 2020 | 18 | 13042 | 2240.0 | 396113.0 | 1033.58 | 3.29 | 2020-04-27 |
| 2020 | 19 | 8353 | 1676.0 | 412140.0 | 1049.92 | 2.03 | 2020-05-04 |
| 2020 | 20 | 6365 | 1348.0 | 439048.0 | 989.79 | 1.45 | 2020-05-11 |
| 2020 | 21 | 4423 | 877.0 | 442052.0 | 1094.28 | 1.0 | 2020-05-18 |
| 2020 | 22 | 3161 | 630.0 | 431727.0 | 1410.95 | 0.73 | 2020-05-25 |
| 2020 | 23 | 1979 | 484.0 | 357796.0 | 1460.33 | 0.55 | 2020-06-01 |
| 2020 | 24 | 1991 | 446.0 | 384183.0 | 522.35 | 0.52 | 2020-06-08 |
| 2020 | 25 | 1912 | 289.0 | 363652.0 | 643.31 | 0.53 | 2020-06-15 |
| 2020 | 26 | 1434 | 104.0 | 330249.0 | 648.54 | 0.43 | 2020-06-22 |
| 2020 | 27 | 1306 | 123.0 | 323669.0 | 696.78 | 0.4 | 2020-06-29 |
| 2020 | 28 | 1466 | 93.0 | 300523.0 | 422.92 | 0.49 | 2020-07-06 |
| 2020 | 29 | 1377 | 91.0 | 299238.0 | 341.32 | 0.46 | 2020-07-13 |
| 2020 | 30 | 1689 | 62.0 | 322523.0 | 301.95 | 0.52 | 2020-07-20 |
| 2020 | 31 | 1970 | 47.0 | 356193.0 | 969.54 | 0.55 | 2020-07-27 |
| 2020 | 32 | 2497 | 51.0 | 333079.0 | 164.2 | 0.75 | 2020-08-03 |
| 2020 | 33 | 3357 | 191.0 | 307573.0 | 119.15 | 1.09 | 2020-08-10 |
| 2020 | 34 | 5438 | 41.0 | 450220.0 | 117.69 | 1.21 | 2020-08-17 |
| 2020 | 35 | 8880 | 40.0 | 578704.0 | 77.7 | 1.53 | 2020-08-24 |
| 2020 | 36 | 9421 | 64.0 | 632916.0 | 102.96 | 1.49 | 2020-08-31 |
| 2020 | 37 | 10084 | 69.0 | 598861.0 | 126.93 | 1.68 | 2020-09-07 |
| 2020 | 38 | 10406 | 97.0 | 614696.0 | 145.11 | 1.69 | 2020-09-14 |
| 2020 | 39 | 11715 | 128.0 | 654250.0 | 153.65 | 1.79 | 2020-09-21 |
| 2020 | 40 | 15462 | 151.0 | 697041.0 | 243.82 | 2.22 | 2020-09-28 |
| 2020 | 41 | 29622 | 180.0 | 780608.0 | 268.38 | 3.79 | 2020-10-05 |
| 2020 | 42 | 59296 | 377.0 | 975869.0 | 250.94 | 6.08 | 2020-10-12 |
| 2020 | 43 | 111550 | 795.0 | 1113420.0 | 230.21 | 10.02 | 2020-10-19 |
| 2020 | 44 | 183577 | 1488.0 | 1313916.0 | 208.9 | 13.97 | 2020-10-26 |
| 2020 | 45 | 225788 | 2568.0 | 1406795.0 | 203.47 | 16.05 | 2020-11-02 |
| 2020 | 46 | 243444 | 3835.0 | 1503673.0 | 208.71 | 16.19 | 2020-11-09 |
| 2020 | 47 | 230349 | 4594.0 | 1510190.0 | 224.62 | 15.25 | 2020-11-16 |
| 2020 | 48 | 176341 | 5081.0 | 1425999.0 | 251.9 | 12.37 | 2020-11-23 |
| 2020 | 49 | 143699 | 5174.0 | 1311089.0 | 297.78 | 10.96 | 2020-11-30 |
| 2020 | 50 | 114885 | 4442.0 | 1090062.0 | 272.1 | 10.54 | 2020-12-07 |
| 2020 | 51 | 112086 | 4279.0 | 913399.0 | 303.96 | 12.27 | 2020-12-14 |
| 2020 | 52 | 95133 | 3126.0 | 917012.0 | 359.81 | 10.37 | 2020-12-21 |
| 2020 | 53 | 107775 | 3407.0 | 880142.0 | 317.51 | 12.25 | 2020-12-28 |
| 2021 | 1 | 120667 | 3423.0 | 965114.0 | 272.15 | 12.5 | 2021-01-04 |
| 2021 | 2 | 104795 | 3422.0 | 1315299.0 | 291.52 | 7.97 | 2021-01-11 |
| 2021 | 3 | 85564 | 3284.0 | 1727343.0 | 322.21 | 4.95 | 2021-01-18 |
| 2021 | 4 | 86272 | 3055.0 | 1732691.0 | 267.06 | 4.98 | 2021-01-25 |
| 2021 | 5 | 83734 | 2757.0 | 1696000.0 | 255.69 | 4.94 | 2021-02-01 |
| 2021 | 6 | 85210 | 2304.0 | 1805855.0 | 232.48 | 4.72 | 2021-02-08 |
| 2021 | 7 | 87435 | 2141.0 | 1890358.0 | 238.58 | 4.63 | 2021-02-15 |
| 2021 | 8 | 116124 | 1981.0 | 2073948.0 | 203.23 | 5.6 | 2021-02-22 |
| 2021 | 9 | 142388 | 2086.0 | 2209958.0 | 196.44 | 6.44 | 2021-03-01 |
| 2021 | 10 | 155934 | 2360.0 | 2280459.0 | 191.81 | 6.84 | 2021-03-08 |
| 2021 | 11 | 153383 | 2797.0 | 2267599.0 | 201.91 | 6.76 | 2021-03-15 |
| 2021 | 12 | 145050 | 2991.0 | 2202385.0 | 222.27 | 6.59 | 2021-03-22 |
| 2021 | 13 | 136312 | 3097.0 | 2106755.0 | 196.09 | 6.47 | 2021-03-29 |
| 2021 | 14 | 101627 | 3224.0 | 1854823.0 | 227.4 | 5.48 | 2021-04-05 |
| 2021 | 15 | 100385 | 2673.0 | 2039578.0 | 193.16 | 4.92 | 2021-04-12 |
| 2021 | 16 | 92568 | 2311.0 | 2031573.0 | 178.9 | 4.56 | 2021-04-19 |
| 2021 | 17 | 82112 | 1939.0 | 1988809.0 | 161.12 | 4.13 | 2021-04-26 |
| 2021 | 18 | 66478 | 1656.0 | 1982198.0 | 160.81 | 3.35 | 2021-05-03 |
| 2021 | 19 | 47942 | 1323.0 | 1805643.0 | 171.25 | 2.66 | 2021-05-10 |
| 2021 | 20 | 33084 | 1069.0 | 1655819.0 | 144.18 | 2.0 | 2021-05-17 |
| 2021 | 21 | 23836 | 821.0 | 1526792.0 | 200.96 | 1.56 | 2021-05-24 |
| 2021 | 22 | 16436 | 477.0 | 1242229.0 | 163.06 | 1.32 | 2021-05-31 |
| 2021 | 23 | 12461 | 479.0 | 1277054.0 | 162.11 | 0.98 | 2021-06-07 |
| 2021 | 24 | 8112 | 268.0 | 1311660.0 | 218.2 | 0.62 | 2021-06-14 |
| 2021 | 25 | 5581 | 202.0 | 1215473.0 | 225.77 | 0.46 | 2021-06-21 |
| 2021 | 26 | 5260 | 177.0 | 1208991.0 | 174.9 | 0.44 | 2021-06-28 |
| 2021 | 27 | 7972 | 126.0 | 1168575.0 | 102.86 | 0.68 | 2021-07-05 |
| 2021 | 28 | 16176 | 92.0 | 1283303.0 | 71.71 | 1.26 | 2021-07-12 |
| 2021 | 29 | 29972 | 82.0 | 1435886.0 | 51.71 | 2.09 | 2021-07-19 |
| 2021 | 30 | 37959 | 116.0 | 1483506.0 | 55.85 | 2.56 | 2021-07-26 |
| 2021 | 31 | 41097 | 155.0 | 1462948.0 | 77.62 | 2.81 | 2021-08-02 |
| 2021 | 32 | 44335 | 212.0 | 1432000.0 | 77.14 | 3.1 | 2021-08-09 |
| 2021 | 33 | 43986 | 319.0 | 1396461.0 | 95.94 | 3.15 | 2021-08-16 |
| 2021 | 34 | 45658 | 342.0 | 1614909.0 | 88.48 | 2.83 | 2021-08-23 |
| 2021 | 35 | 41226 | 422.0 | 1901730.0 | 94.84 | 2.17 | 2021-08-30 |
| 2021 | 36 | 35004 | 404.0 | 1933833.0 | 110.56 | 1.81 | 2021-09-06 |
| 2021 | 37 | 29736 | 391.0 | 1966654.0 | 112.32 | 1.51 | 2021-09-13 |
| 2021 | 38 | 24236 | 387.0 | 1978362.0 | 111.4 | 1.23 | 2021-09-20 |
| 2021 | 39 | 21458 | 334.0 | 2002115.0 | 111.85 | 1.07 | 2021-09-27 |
| 2021 | 40 | 18300 | 270.0 | 1930204.0 | 155.74 | 0.95 | 2021-10-04 |
| 2021 | 41 | 17602 | 240.0 | 2393249.0 | 155.66 | 0.74 | 2021-10-11 |
| 2021 | 42 | 23305 | 285.0 | 3324669.0 | 122.29 | 0.7 | 2021-10-18 |
| 2021 | 43 | 30792 | 274.0 | 3202869.0 | 126.66 | 0.96 | 2021-10-25 |
| 2021 | 44 | 36095 | 285.0 | 3087166.0 | 111.37 | 1.17 | 2021-11-01 |
| 2021 | 45 | 51318 | 390.0 | 3463133.0 | 96.85 | 1.48 | 2021-11-08 |
| 2021 | 46 | 65460 | 402.0 | 3697483.0 | 79.59 | 1.77 | 2021-11-15 |
| 2021 | 47 | 82158 | 497.0 | 3836023.0 | 77.41 | 2.14 | 2021-11-22 |
| 2021 | 48 | 101313 | 521.0 | 3999354.0 | 79.95 | 2.53 | 2021-11-29 |
| 2021 | 49 | 116499 | 636.0 | 3657401.0 | 83.26 | 3.19 | 2021-12-06 |
| 2021 | 50 | 163648 | 810.0 | 4376218.0 | 63.25 | 3.74 | 2021-12-13 |
| 2021 | 51 | 258143 | 970.0 | 4986419.0 | 53.92 | 5.18 | 2021-12-20 |
| 2021 | 52 | 680688 | 1035.0 | 6192041.0 | 30.35 | 10.99 | 2021-12-27 |
| 2022 | 1 | 1108961 | 1392.0 | 6611935.0 | 21.81 | 16.77 | 2022-01-03 |
| 2022 | 2 | 1219324 | 2066.0 | 7638066.0 | 21.54 | 15.96 | 2022-01-10 |
| 2022 | 3 | 1165753 | 2419.0 | 7409388.0 | 22.49 | 15.73 | 2022-01-17 |
| 2022 | 4 | 976223 | 2626.0 | 6946828.0 | 22.99 | 14.05 | 2022-01-24 |
| 2022 | 5 | 694173 | 2622.0 | 6023076.0 | 28.44 | 11.53 | 2022-01-31 |
| 2022 | 6 | 481681 | 2244.0 | 4522069.0 | 32.61 | 10.65 | 2022-02-07 |
| 2022 | 7 | 363398 | 1974.0 | 3447950.0 | 36.52 | 10.54 | 2022-02-14 |
| 2022 | 8 | 289598 | 1571.0 | 2991358.0 | 33.87 | 9.68 | 2022-02-21 |
| 2022 | 9 | 255656 | 1327.0 | 2642537.0 | 35.87 | 9.67 | 2022-02-28 |
| 2022 | 10 | 340825 | 981.0 | 2780213.0 | 29.25 | 12.26 | 2022-03-07 |
| 2022 | 11 | 477340 | 917.0 | 3151885.0 | 20.99 | 15.14 | 2022-03-14 |
| 2022 | 12 | 495537 | 997.0 | 3311639.0 | 19.45 | 14.96 | 2022-03-21 |
| 2022 | 13 | 479724 | 1002.0 | 3240001.0 | 19.57 | 14.81 | 2022-03-28 |
| 2022 | 14 | 439580 | 964.0 | 4135788.0 | 22.77 | 10.63 | 2022-04-04 |
| 2022 | 15 | 416362 | 939.0 | 2770358.0 | 22.19 | 15.03 | 2022-04-11 |
| 2022 | 16 | 420457 | 1001.0 | 2521554.0 | 20.86 | 16.67 | 2022-04-18 |
| 2022 | 17 | 364817 | 924.0 | 2369443.0 | 20.7 | 15.4 | 2022-04-25 |
| 2022 | 18 | 291534 | 877.0 | 2007367.0 | 24.29 | 14.52 | 2022-05-02 |
| 2022 | 19 | 256447 | 755.0 | 1785016.0 | 24.06 | 14.37 | 2022-05-09 |
| 2022 | 20 | 187156 | 708.0 | 1578425.0 | 20.3 | 11.86 | 2022-05-16 |
| 2022 | 21 | 138122 | 617.0 | 1353911.0 | 32.0 | 10.2 | 2022-05-23 |
| 2022 | 22 | 114426 | 380.0 | 1078784.0 | 28.84 | 10.61 | 2022-05-30 |
| 2022 | 23 | 144333 | 442.0 | 1160749.0 | 26.4 | 12.43 | 2022-06-06 |
| 2022 | 24 | 219234 | 330.0 | 1232380.0 | 20.21 | 17.79 | 2022-06-13 |
| 2022 | 25 | 350017 | 381.0 | 1554587.0 | 16.03 | 22.52 | 2022-06-20 |
| 2022 | 26 | 528722 | 443.0 | 1988512.0 | 15.49 | 26.59 | 2022-06-27 |
| 2022 | 27 | 662236 | 561.0 | 2418223.0 | 14.35 | 27.39 | 2022-07-04 |
| 2022 | 28 | 652044 | 819.0 | 2644490.0 | 18.57 | 24.66 | 2022-07-11 |
| 2022 | 29 | 509060 | 950.0 | 2354900.0 | 20.63 | 21.62 | 2022-07-18 |
| 2022 | 30 | 376763 | 1211.0 | 1959866.0 | 24.52 | 19.22 | 2022-07-25 |
| 2022 | 31 | 272156 | 1050.0 | 1577590.0 | 24.32 | 17.25 | 2022-08-01 |
| 2022 | 32 | 186133 | 924.0 | 1232988.0 | 33.58 | 15.1 | 2022-08-08 |
| 2022 | 33 | 150954 | 662.0 | 965776.0 | 32.13 | 15.63 | 2022-08-15 |
| 2022 | 34 | 156055 | 625.0 | 1023784.0 | 24.16 | 15.24 | 2022-08-22 |
| 2022 | 35 | 131788 | 485.0 | 1018577.0 | 28.0 | 12.94 | 2022-08-29 |
| 2022 | 36 | 110014 | 377.0 | 964808.0 | 27.45 | 11.4 | 2022-09-05 |
| 2022 | 37 | 113008 | 369.0 | 936020.0 | 23.89 | 12.07 | 2022-09-12 |
| 2022 | 38 | 142518 | 302.0 | 1032303.0 | 25.89 | 13.81 | 2022-09-19 |
| 2022 | 39 | 225904 | 270.0 | 1216814.0 | 20.76 | 18.57 | 2022-09-26 |
| 2022 | 40 | 286501 | 369.0 | 1417512.0 | 21.15 | 20.21 | 2022-10-03 |
| 2022 | 41 | 284270 | 469.0 | 1507797.0 | 19.7 | 18.85 | 2022-10-10 |
| 2022 | 42 | 247519 | 606.0 | 1446463.0 | 22.06 | 17.11 | 2022-10-17 |
| 2022 | 43 | 201466 | 560.0 | 1282700.0 | 24.07 | 15.71 | 2022-10-24 |
| 2022 | 44 | 167298 | 546.0 | 1106423.0 | 31.74 | 15.12 | 2022-10-31 |
| 2022 | 45 | 183332 | 485.0 | 1144580.0 | 33.05 | 16.02 | 2022-11-07 |
| 2022 | 46 | 224180 | 531.0 | 1232125.0 | 29.75 | 18.19 | 2022-11-14 |
| 2022 | 47 | 226475 | 606.0 | 1308350.0 | 29.94 | 17.31 | 2022-11-21 |
| 2022 | 48 | 229271 | 667.0 | 1309391.0 | 33.63 | 17.51 | 2022-11-28 |
| 2022 | 49 | 196084 | 678.0 | 1129881.0 | 39.47 | 17.35 | 2022-12-05 |
| 2022 | 50 | 167238 | 771.0 | 1132439.0 | 45.44 | 14.77 | 2022-12-12 |
| 2022 | 51 | 132160 | 774.0 | 962383.0 | 46.38 | 13.73 | 2022-12-19 |
| 2022 | 52 | 133603 | 760.0 | 802500.0 | 45.06 | 16.65 | 2022-12-26 |
| 2023 | 1 | 104511 | 613.0 | 754480.0 | 41.14 | 13.85 | 2023-01-02 |
| 2023 | 2 | 72148 | 602.0 | 790267.0 | 43.24 | 9.13 | 2023-01-09 |
| 2023 | 3 | 45105 | 430.0 | 640763.0 | 99.32 | 7.04 | 2023-01-16 |
| 2023 | 4 | 35109 | 312.0 | 612656.0 | 72.06 | 5.73 | 2023-01-23 |
| 2023 | 5 | 32802 | 448.0 | 563747.0 | 96.03 | 5.82 | 2023-01-30 |
| 2023 | 6 | 28646 | 253.0 | 524213.0 | 84.48 | 5.46 | 2023-02-06 |
| 2023 | 7 | 29396 | 315.0 | 541007.0 | 74.16 | 5.43 | 2023-02-13 |
| 2023 | 8 | 28947 | 242.0 | 514249.0 | 74.62 | 5.63 | 2023-02-20 |
| 2023 | 9 | 24636 | 218.0 | 511974.0 | 73.47 | 4.81 | 2023-02-27 |
| 2023 | 10 | 24372 | 216.0 | 468403.0 | 74.27 | 5.2 | 2023-03-06 |
| 2023 | 11 | 22684 | 181.0 | 451174.0 | 81.11 | 5.03 | 2023-03-13 |
| 2023 | 12 | 22597 | 181.0 | 429923.0 | 62.84 | 5.26 | 2023-03-20 |
| 2023 | 13 | 21071 | 184.0 | 438316.0 | 64.07 | 4.81 | 2023-03-27 |
| 2023 | 14 | 19959 | 142.0 | 347198.0 | 99.7 | 5.75 | 2023-04-03 |
| 2023 | 15 | 25390 | 135.0 | 358091.0 | 60.26 | 7.09 | 2023-04-10 |
| 2023 | 16 | 26370 | 199.0 | 381427.0 | 70.53 | 6.91 | 2023-04-17 |
| 2023 | 17 | 22710 | 153.0 | 328192.0 | 68.69 | 6.92 | 2023-04-24 |
| 2023 | 18 | 19560 | 186.0 | 307182.0 | 79.75 | 6.37 | 2023-05-01 |
| 2023 | 19 | 16520 | 156.0 | 285323.0 | 95.64 | 5.79 | 2023-05-08 |
| 2023 | 20 | 14299 | 156.0 | 252732.0 | 72.73 | 5.66 | 2023-05-15 |
| 2023 | 21 | 14744 | 158.0 | 260670.0 | 73.25 | 5.66 | 2023-05-22 |
| 2023 | 22 | 10632 | 104.0 | 216872.0 | 75.24 | 4.9 | 2023-05-29 |
| 2023 | 23 | 9069 | 108.0 | 225059.0 | 90.42 | 4.03 | 2023-06-05 |
| 2023 | 24 | 6700 | 80.0 | 200237.0 | 92.54 | 3.35 | 2023-06-12 |
| 2023 | 25 | 5235 | 82.0 | 187456.0 | 57.31 | 2.79 | 2023-06-19 |
| 2023 | 26 | 4293 | 62.0 | 176902.0 | 100.16 | 2.43 | 2023-06-26 |
| 2023 | 27 | 3550 | 30.0 | 163497.0 | 118.31 | 2.17 | 2023-07-03 |
| 2023 | 28 | 3311 | 43.0 | 161109.0 | 51.34 | 2.06 | 2023-07-10 |
| 2023 | 29 | 3629 | 42.0 | 148253.0 | 137.78 | 2.45 | 2023-07-17 |
| 2023 | 30 | 4562 | 17.0 | 134678.0 | 168.79 | 3.39 | 2023-07-24 |
| 2023 | 31 | 6284 | 50.0 | 136687.0 | 62.06 | 4.6 | 2023-07-31 |
| 2023 | 32 | 6221 | 77.0 | 109684.0 | 98.05 | 5.67 | 2023-08-07 |
| 2023 | 33 | 8304 | 39.0 | 98370.0 | 92.73 | 8.44 | 2023-08-14 |
| 2023 | 34 | 13182 | 61.0 | 135443.0 | 69.03 | 9.73 | 2023-08-21 |
| 2023 | 35 | 17759 | 77.0 | 155083.0 | 59.69 | 11.45 | 2023-08-28 |
| 2023 | 36 | 25674 | 91.0 | 186333.0 | 52.58 | 13.78 | 2023-09-04 |
| 2023 | 37 | 35305 | 106.0 | 227177.0 | 38.24 | 15.54 | 2023-09-11 |
| 2023 | 38 | 38375 | 135.0 | 243984.0 | 38.83 | 15.73 | 2023-09-18 |
| 2023 | 39 | 40623 | 135.0 | 259405.0 | 42.59 | 15.66 | 2023-09-25 |
| 2023 | 40 | 44327 | 149.0 | 279218.0 | 48.05 | 15.88 | 2023-10-02 |
| 2023 | 41 | 37350 | 173.0 | 251031.0 | 42.57 | 14.88 | 2023-10-09 |
| 2023 | 42 | 29421 | 213.0 | 232921.0 | 56.76 | 12.63 | 2023-10-16 |
| 2023 | 43 | 28445 | 159.0 | 219966.0 | 57.3 | 12.93 | 2023-10-23 |
| 2023 | 44 | 25276 | 167.0 | 186142.0 | 90.2 | 13.58 | 2023-10-30 |
| 2023 | 45 | 30429 | 163.0 | 218810.0 | 79.2 | 13.91 | 2023-11-06 |
| 2023 | 46 | 41114 | 228.0 | 235469.0 | 80.26 | 17.46 | 2023-11-13 |
| 2023 | 47 | 46900 | 241.0 | 258386.0 | 62.26 | 18.15 | 2023-11-20 |
| 2023 | 48 | 57890 | 330.0 | 299556.0 | 69.1 | 19.33 | 2023-11-27 |
| 2023 | 49 | 53075 | 292.0 | 262203.0 | 77.63 | 20.24 | 2023-12-04 |
| 2023 | 50 | 66489 | 400.0 | 324260.0 | 45.12 | 20.5 | 2023-12-11 |
| 2023 | 51 | 57902 | 412.0 | 320600.0 | 54.75 | 18.06 | 2023-12-18 |
| 2023 | 52 | 36839 | 300.0 | 223066.0 | 78.45 | 16.51 | 2023-12-25 |
| 2024 | 1 | 22706 | 317.0 | 189423.0 | 105.26 | 11.99 | 2024-01-01 |
| 2024 | 2 | 14567 | 289.0 | 209946.0 | 109.84 | 6.94 | 2024-01-08 |
| 2024 | 3 | 7287 | 239.0 | 168278.0 | 145.46 | 4.33 | 2024-01-15 |
| 2024 | 4 | 4464 | 160.0 | 155005.0 | 206.09 | 2.88 | 2024-01-22 |
| 2024 | 5 | 3340 | 106.0 | 144200.0 | 194.61 | 2.32 | 2024-01-29 |
| 2024 | 6 | 2496 | 92.0 | 143926.0 | 172.28 | 1.73 | 2024-02-05 |
| 2024 | 7 | 1864 | 65.0 | 136657.0 | 203.86 | 1.36 | 2024-02-12 |
| 2024 | 8 | 1337 | 43.0 | 138430.0 | 231.86 | 0.97 | 2024-02-19 |
| 2024 | 9 | 1011 | 38.0 | 132379.0 | 375.87 | 0.76 | 2024-02-26 |
| 2024 | 10 | 894 | 31.0 | 126918.0 | 279.64 | 0.7 | 2024-03-04 |
| 2024 | 11 | 768 | 38.0 | 138435.0 | 260.42 | 0.55 | 2024-03-11 |
| 2024 | 12 | 664 | 25.0 | 123398.0 | 180.72 | 0.54 | 2024-03-18 |
| 2024 | 13 | 531 | 20.0 | 107233.0 | 225.99 | 0.5 | 2024-03-25 |
| 2024 | 14 | 568 | 12.0 | 105017.0 | 211.27 | 0.54 | 2024-04-01 |
| 2024 | 15 | 575 | 12.0 | 114748.0 | 156.52 | 0.5 | 2024-04-08 |
| 2024 | 16 | 575 | 12.0 | 107534.0 | 69.57 | 0.53 | 2024-04-15 |
| 2024 | 17 | 500 | 9.0 | 81986.0 | 260.0 | 0.61 | 2024-04-22 |
| 2024 | 18 | 650 | 4.0 | 77717.0 | 215.38 | 0.84 | 2024-04-29 |
| 2024 | 19 | 729 | 13.0 | 89563.0 | 150.89 | 0.81 | 2024-05-06 |
| 2024 | 20 | 956 | 14.0 | 95361.0 | 94.14 | 1.0 | 2024-05-13 |
| 2024 | 21 | 931 | 11.0 | 87443.0 | 118.15 | 1.06 | 2024-05-20 |
| 2024 | 22 | 1230 | 9.0 | 78646.0 | 138.21 | 1.56 | 2024-05-27 |
| 2024 | 23 | 1596 | 11.0 | 87324.0 | 119.05 | 1.83 | 2024-06-03 |
| 2024 | 24 | 1957 | 17.0 | 84615.0 | 91.98 | 2.31 | 2024-06-10 |
| 2024 | 25 | 2233 | 19.0 | 79805.0 | 107.48 | 2.8 | 2024-06-17 |
| 2024 | 26 | 3102 | 18.0 | 80163.0 | 151.52 | 3.87 | 2024-06-24 |
| 2024 | 27 | 4490 | 24.0 | 76267.0 | 93.54 | 5.89 | 2024-07-01 |
| 2024 | 28 | 7634 | 47.0 | 77057.0 | 69.43 | 9.91 | 2024-07-08 |
| 2024 | 29 | 11104 | 42.0 | 89689.0 | 60.34 | 12.38 | 2024-07-15 |
| 2024 | 30 | 16232 | 53.0 | 103283.0 | 68.38 | 15.72 | 2024-07-22 |
| 2024 | 31 | 17373 | 67.0 | 105434.0 | 49.5 | 16.48 | 2024-07-29 |
| 2024 | 32 | 17405 | 111.0 | 94625.0 | 70.09 | 18.39 | 2024-08-05 |
| 2024 | 33 | 13449 | 86.0 | 72197.0 | 72.12 | 18.63 | 2024-08-12 |
| 2024 | 34 | 15499 | 122.0 | 89451.0 | 63.23 | 17.33 | 2024-08-19 |
| 2024 | 35 | 13902 | 97.0 | 88660.0 | 62.58 | 15.68 | 2024-08-26 |
| 2024 | 36 | 11069 | 98.0 | 89871.0 | 72.27 | 12.32 | 2024-09-02 |
| 2024 | 37 | 8745 | 87.0 | 84464.0 | 144.08 | 10.35 | 2024-09-09 |
| 2024 | 38 | 9260 | 80.0 | 79184.0 | 96.11 | 11.69 | 2024-09-16 |
| 2024 | 39 | 12994 | 126.0 | 92369.0 | 92.35 | 14.07 | 2024-09-23 |
| 2024 | 40 | 12673 | 89.0 | 94526.0 | 89.17 | 13.41 | 2024-09-30 |
| 2024 | 41 | 11447 | 120.0 | 92595.0 | 98.72 | 12.36 | 2024-10-07 |
| 2024 | 42 | 10123 | 113.0 | 92045.0 | 94.83 | 11.0 | 2024-10-14 |
| 2024 | 43 | 7049 | 113.0 | 85594.0 | 133.35 | 8.24 | 2024-10-21 |
| 2024 | 44 | 4558 | 96.0 | 66921.0 | 142.61 | 6.81 | 2024-10-28 |
| 2024 | 45 | 3214 | 94.0 | 71144.0 | 161.79 | 4.52 | 2024-11-04 |
| 2024 | 46 | 2564 | 65.0 | 62929.0 | 198.91 | 4.07 | 2024-11-11 |
| 2024 | 47 | 2289 | 52.0 | 59455.0 | 222.8 | 3.85 | 2024-11-18 |
| 2024 | 48 | 2208 | 51.0 | 56887.0 | 167.57 | 3.88 | 2024-11-25 |
| 2024 | 49 | 2205 | 51.0 | 67748.0 | 158.73 | 3.25 | 2024-12-02 |
| 2024 | 50 | 1925 | 37.0 | 55261.0 | 145.45 | 3.48 | 2024-12-09 |
| 2024 | 51 | 1929 | 35.0 | 55309.0 | 228.1 | 3.49 | 2024-12-16 |
| 2024 | 52 | 1498 | 28.0 | 35016.0 | 4.28 | 2024-12-23 | |
| 2025 | 1 | 1667 | 44.0 | 38274.0 | 4.36 | 2024-12-30 |
Enjoy. ldfa